
What does all this reporting mean?
Assets from webinar held on 13 April 2021
Find out how to use our powerful insights and reporting to boost your student recruitment. Best practice solutions for marketers.
Watch the webinar recording:
What does all this reporting mean?
Presenters: Hulda Fridriksdottir (Client Services Manager) and Paul Cernicharo-Terol (Sales Director)

Why does reporting matter?
The digital landscape is changing and we need reporting to:
- Evaluate activities based on performance
- Identify what is and is not working
- Inform and forecast for the future
Get help with reporting
WEBINAR ATTENDEE POLL: What is the main use of reporting for you? (multi select)
Generally monitor performance
Show what is working
Identify areas to improve
Understand value (ROI)
Forecast for the future
Understanding reporting metrics
Metrics are marketing: you can use objective metrics to tell a subjective story that is good, bad, or neutral - it depends on how you define your objectives. e.g. YoY growth, but under target. Is this good?
Take a holistic approach to reporting: use both internal and external reporting and track all activity so that you understand what happens when people engage with you. For example, a high CTR% and a high bounce rate might suggest your audience is engaged, but your landing page is a weak point in the customer journey.
There is no "bad" data: metrics provide insights that help you identify areas to focus on to boost performance. e.g. refining your audience targeting, or changing your creative

Attribution modelling
How marketers assess the value/ROI of activity
The challenge of attribution modelling is that multiple touchpoints may contribute towards a customer purchasing decision, so how can marketers decide which activity caused the sale? It's important to use an attribution model which is fit-for-purpose, however the majority of businesses use single source:
Single source attribution
Single source attribution can lower the perceived effectiveness of the channels/activities which are not credited. This may result in marketers stopping effective activities because they can't prove ROI. The model can be inaccurate because it does not capture all the channels which contributed to the decision.
- First touch attribution: all the credit goes to the first channel the lead engaged with. Subsequent activities get zero credit for the sale.
- Last touch attribution: all the credit goes to the last channel the lead engaged with. Prior activities are not credited.
We asked webinar attendees what they do when their reporting shows bad performance against marketing activities:
POLL 2: What is your protocol when looking at bad performance?
Identify areas that are working well and focus efforts on them
Identify areas that are NOT working well and focus efforts on them
Repeat the activity to gain more insight
Cease all relevant activity

Multi-source attribution (MTA model)
MTA models are more impartial and give a clearer understanding of which activities influence decision-making, but they are more complex to implement. Here are a few different methods you can use:
- Linear: equal weight to all touchpoints.
- Time-decay: gives credit to more recent touchpoints.
- U-shaped: 40% to lead creation, 40% to last touch, 20% divided between activities in the middle.
- W-shaped: 30% to lead creation, 30% to opportunity creation, 30% to last touch, 10% divided between activities occurring anytime from lead creation and last touch.
- Full path: W model, but also includes stages between opportunity creation and final close. One of the biggest benefits of this model is that it accounts for the sales team’s post-opportunity follow-up interactions, giving them the same weight as early-stage marketing activities.
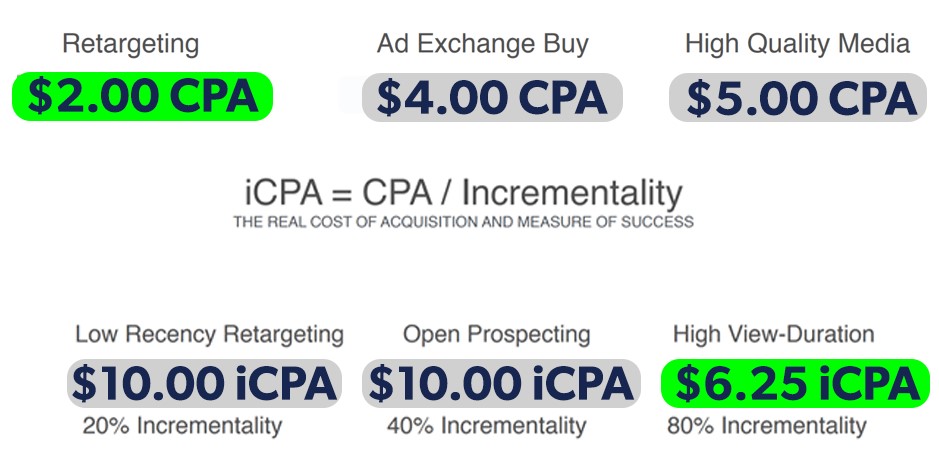
Incrementality
Lets you track shifts in customer behaviour or attitudes and measure the true impact of your activities
CPAs can be misleading - retargeting is usually a clear winner over high-quality contextual media like The Student Room or other similar advertisers. But this doesn't give you the full picture.
Measure the uplift, not just the CPA
In this example, we show how the cost per acquisition changes when you take incrementality into account. Retargeting looks great at $2, but what if you would have secured 80% of this business with no spend at all? Then only 20% of your acquisitions are uplift/behaviour change. 20% incrementality would make your iCPA $10.

Will be blocked on Google Chrome (early 2022)
Google won't support user-level identifiers from third-parties
Privacy first future for the web
Is FLoC (Federated Learning of Cohorts) the new solution?
FLoC is a privacy-focused solution intent on delivering relevant ads “by clustering large groups of people with similar interests.”
Google is confident this solution will work - watch the space.
Impact on marketers?
Retargeting activity via Google gone. Uncertainty around attribution, reporting and activity tracking.
So test FLoC, speak to your media partners about their plans, and find contextually relevant partners with the highest post-click conversion rates.
We asked webinar attendees if they were prepared for a cookie-less world. None of the respondents had a solid plan in place, 3% said they were working on a plan, 70% had some idea of what they would do, and the remaining 27% had not done anything about cookies yet.
Reporting The Student Room can do for you
Advances in reporting
We've made some improvements that we think you will like:
Ada: easier to understand, refined which metrics are included, additional insights about how your audience interacts with your brand
TSR Talks: includes unique pageviews, posts and posters, geographical and roadblocking information.
University Partner Pack (UPP): reviews key periods (e.g. Clearing and UCAS deadlines) as well as annual and monthly performance. Now includes: audience overlap with other unis - who has the highest share of your audience on TSR?, total searches for uni, average users vs average UPP, average page split vs average UPP


University Partner Pack (UPP) Conversion tracking
Find out how your UPP is creating conversions for you: we use a partial GTM code to capture conversions which came from your UPP pages. These are split into three areas:
- General
- Course
- Focused/low funnel
38.4% of UPP clients have already opted in and we have successfully tracked 777,052 conversions in the last year.
If you would like to be included please contact: hulda.f@thestudentroom.com or your Account Manager
Key takeaways
-
- Combine internal and external reports to get a holistic 360 view of performance
- Use data insights to inform future campaigns - there are no negative metrics, there is only information
- Consider which attribution model is best for you
- Try out incrementally tools (but do it now before cookies end)
- Start planning your post-cookie strategy now
- High campaign performance is not always the goal e.g. you might do brand work to target students in a new area and accept a lower ROI
- Talk to us about how we can support you with your reporting needs